

Capstone students build energy dashboard
Southern Oregon University buildings use thousands of kilowatt-hours of electricity each day to power classrooms, residence halls, offices, laboratories, lighting, and heating and cooling systems. While electricity meters across campus collect detailed information about energy usage, the information was not easily accessible until group of Computer Science students changed that with their senior capstone project.
The team developed the SOU Energy Dashboard, a custom interactive web application created for SOU’s Sustainability Office. The dashboard gathers electricity data from across campus and puts it into a single platform where students, faculty and staff can view building energy use and compare performance across campus.
 “The dashboard was designed to transform raw energy data into actionable information,” said Becs Walker, SOU sustainability director and the dashboard project’s client. “By making electricity use more visible and accessible, the dashboard can help the university identify opportunities to reduce utility costs, improve energy efficiency, lower carbon emissions and support long-term sustainability planning.”
The project also supports SOU’s Living Laboratory approach, where students apply classroom knowledge to challenges that face the campus and surrounding community. In this case, the capstone team created a tool that is both valuable to the university and creates new opportunities for teaching and experiential learning. The data can be incorporated into future coursework and student projects, as well as future sustainability initiatives.
For student David Trujillo, the project connected closely to a personal interest in sustainability.
“I have always felt that energy efficiency is something that should be a higher priority, and I thought it would be a great opportunity to make something that could have a positive impact,” he said.
Luke Wulf was drawn to the technical side of the project, especially the opportunity to work with databases and data visualization.
“I really enjoy working on storing data in databases, and this project interested me due to that reason,” Wulf said. “I thought storing information and needing to display it in a way for anyone was also a fantastic goal, and should be something we already had.”
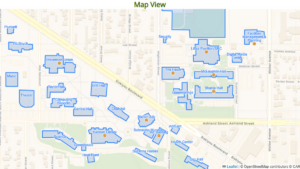
The dashboard includes visual tools such as charts and a campus map page, which helps users interpret the information that previously existed mainly as numbers in spreadsheets. For Trujillo, the charts stood out because they addressed one of the main challenges that the Sustainability Office faced.
“(The charts) are a powerful tool that solves one of the core problems Sustainability was facing with all the data just being numbers in spreadsheets,” he said. “It was difficult and time consuming to derive meaning from the data, but now it can be understood at a glance.”
Griffin Greimes focused on the Electricity Dashboard map page, which was designed to be understandable and useful to anyone interested in learning more about the electricity usage across campus.
“I think I am most proud of the work that I’ve done on the Electricity Dashboard Map page,” Greimes said. “Making an easily accessible and understandable page that anyone is able to engage with, that looks good and is immediately useful to anyone interested in learning more about the electricity usage, is something that can always use additions and improvements.”
Behind the scenes, the project also included important software development infrastructure. Student Cory Short’s work included the team’s Continuous Integration and Continuous Deployment pipeline, which automates website updates whenever approved changes are made to the codebase.
The group also worked closely with SOU Information Technology, giving the students experience that felt much closer to professional software development than a traditional class assignment. Wulf said that process taught him how software development works in the real world.
“(With) our work with IT as a third-party developer, our work was treated like a real thing, given tasks we had to complete to meet our goal,” he said. “This process made all of us learn how it will be like in the real world, where not everything can be updated with just some light persuasion, but instead, long hard hours of working on code.”
Short had a similar takeaway.
“I learned a lot about how a project can be run and a lot about GitHub infrastructure and cloud infrastructure,” he said. “The whole project ended up feeling a lot like it was closer to a job than a class we were doing for a grade.”
Trujillo said the capstone project also gave him practical experience with the tools and processes used in industry.
“I really appreciate the insight gained from sprints, client and manager meetings, getting hands-on experience in GitHub, and all the other things I learned that will be applicable to working in the industry,” he said.
One of the biggest challenges came late in the process, when the team had to address ADA accessibility requirements. The requirement was introduced about a month before the end of the term, and the group had to work quickly to meet all 50 requirements in about two weeks.
When asked about the project’s obstacles, the team had a clear, collective answer:
“Absolutely ADA. It was a requirement given to us only about a month before the end of term, and we had to work through it extremely quickly. We managed to get through all 50 requirements in just two weeks, although we accidentally used the entire budget for GitHub Actions for the month by doing it.”
Despite this challenge, the team successfully brought the project to a point where it could function as an official university tool and website. For Wulf, one of the most exciting moments was getting the dashboard connected to its own SOU subdomain.
“When we started this, we had no idea we would have our own subdomain on the sou.edu pages,” he said. “But this term, we’ve done a huge amount of work on making it happen, and finally getting that up was easily the proudest I’ve been in this whole project. I think I’ve told everyone in my life about it at least a few times.”
The dashboard may also create opportunities for future student work. Because the energy data is now easier to understand and access, it could be used in various ways such as coursework, research or future capstone projects.
“Part of the point of this project was to build a way for people to view energy usage at SOU, using it to analyze and compare,” the team said. “Along with that, our client was excited about the idea of students possibly using it for capstones, now that the data is easily accessible.”
For the recent capstone students, completing the dashboard marked both the end of their undergraduate Computer Science experience and the beginning of something that may continue to serve the university for years to come.
“It feels fantastic to have a finished product that has been put to such official use by the school,” Wulf said. “I’m so proud to have something that I know people will use, as well as something I’m happy and excited to show to others.”
Trujillo said the experience felt like a climax of the CS program.
“It really feels like the culmination of everything we have learned across CS, where we get to finally put everything we learned together to build something real and tangible,” he said. “It’s been extremely satisfying.”
For Short, the most rewarding part is seeing six months of work become something real.
“It feels quite satisfying to see what we built over six months actually function and exist now,” he said. “And hopefully we can look back to see it still running in several years from now.”
The team also sees many possibilities for the dashboard’s future. With more time, they would have liked to add filtering options to the map page, which would allow users to view specific categories of buildings, such as classrooms. They also hoped to eventually incorporate live data readings, though that would require a larger-scale project with additional IT support.
“Part of the point of this project was to build a way for people to view energy usage at SOU, using it to analyze and compare,” the team said. “Along with that, our client was excited about the idea of students possibly using it for capstones, now that the data is easily accessible.”
Story by Felicity Johnson, SOU Computer Science Major

